T2 - Infectious Challenge Time Series
[ ]:
import numpy as np
import pandas as pd
import matplotlib.pyplot as plt

from emodlib.malaria import IntrahostComponent, create_config
[ ]:
duration = 300

asexuals = np.zeros(duration)
gametocytes = np.zeros(duration)

config = create_config()
ic = IntrahostComponent.create(config)
ic.challenge()

for t in range(duration):
    ic.update(dt=1)
    asexuals[t] = ic.parasite_density
    gametocytes[t] = ic.gametocyte_density

df = pd.DataFrame({'days': range(duration),
                   'parasite_density': asexuals,
                   'gametocyte_density': gametocytes}).set_index('days')
[3]:
df.head(10)
[3]:
| parasite_density | gametocyte_density | |
|---|---|---|
| days | ||
| 0 | 0.000000 | 0.0 |
| 1 | 0.000000 | 0.0 |
| 2 | 0.000000 | 0.0 |
| 3 | 0.000000 | 0.0 |
| 4 | 0.000000 | 0.0 |
| 5 | 0.000000 | 0.0 |
| 6 | 0.003000 | 0.0 |
| 7 | 0.003000 | 0.0 |
| 8 | 0.047676 | 0.0 |
| 9 | 0.047676 | 0.0 |
[4]:
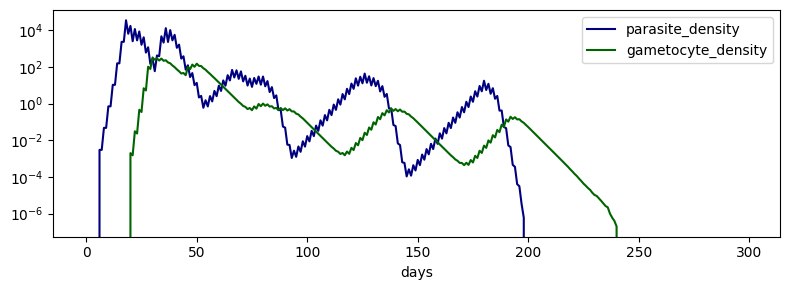
fig, ax = plt.subplots(1, 1, figsize=(8, 3))
df.plot(ax=ax, color=dict(parasite_density='navy', gametocyte_density='darkgreen'))
ax.set(yscale='log')
fig.set_tight_layout(True)